Tags
cognitive bias, cognitive heuristic, conservative bias, gun control, ideology, liberal bias, partisanship, political behavior, political bias, political ideology, political parties, political partisanship, politics, psychology
Sometimes it can get frustrating when discussing policy issues with somebody who has strong political opinions. You point out a fact that supports your case and they twist it around into supporting their case or they simply ignore. Occasionally it gets so bad you start wondering if you both are even looking at the same reality.
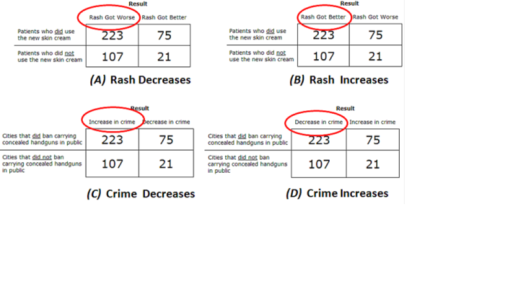
A recent study from the Social Science Research Network (SSRN) may shed some light on how ideology can play a role in the interpretation of facts. In the study people were measured on ideology and numeracy which involves making valid inferences from quantitative data and mathematical ability. Then the participants were presented with one of four scenarios. Two scenarios involved a skin rash treatment where one indicated the treatment made the rash worse and the other showed the treatment made the rash better. The other two scenarios involved gun control; one showed gun control decreased crime and the other showed that gun control increased crime. Each scenario provided a table of numbers and the subjects were asked what results the study supported. Bellow you can see each of the four conditions. Take note that the numbers are identical but the labels are changed. One would think people could draw the same inferences from the same numbers regardless of how the table is labeled.
Now overall people had difficulty with this task, only 41% got it right. But that is not surprising the table is actually designed to make people want to draw the wrong inference if they utilized cognitive heuristics instead of critically thinking about the numbers. But as expected those individuals that scored higher on numeracy were more likely to get the correct answer.
The interesting thing is that overall in the skin rash conditions people performed equally. Yet in the gun control conditions performance differed based on ideology. When conservatives saw the condition where gun control leads to an increase in crime they got the correct answer more often but when conservatives were in the condition where gun control resulted in less crime they got the answer correct less often. The opposite was true of liberals who got it right more often when gun control resulted in less crime and got it incorrect more often when gun control resulted in more crime. Though the numbers in the table were identical for both gun control conditions and both skin rash conditions and the only difference was the labeling.
Furthermore correct interpretation differed based on the individual’s numeracy. While those with higher numeracy performed better in the skin rash condition that was not always the case in the gun control condition. Those with higher numeracy performed best when the results were consistent with their ideology and performed worse when the results contradicted their ideology.
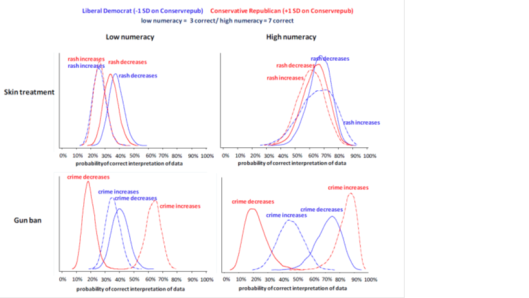
Presented below are the results based on ideology and numeracy for all four conditions. First look at the skin rash condition since that is the baseline and behaves as expected. You can see that there was pretty much no difference in performance based on ideology. Also the participants got the answers correct regardless of whether the skin rash treatment increased or decreased rashes. You can tell this because the distributions for each of the four groups on the first two graphs are very close together and overlap a great deal. Furthermore you can see that when people were higher in numeracy that they got the correct answer more. You can see this by the fact that the centers of the distributions are further to the right in the second graph compared to the first graph.
Now look at the third and fourth graphs and you will see very different results. The distributions are much more spread apart and overlap far less. Conservatives get the correct answer far more when gun control causes an increase in crime while liberals get the correct answer far more when gun control decreases crime. In addition if you look at graph four which is for high numeracy the distributions are spread even further apart. That shows that those with higher numeracy abilities are being affected by their ideology to an even greater extent than those with low numeracy.
This goes to show that when facts are ideologically loaded people perform differentially at interpreting the data. They are most apt to correctly interpret data that is consistent with their ideology and less likely to correctly interpret data that is inconsistent with their ideology. Furthermore those that are best at interpreting data were the most likely to misinterpret data based on ideology. Frequently we want to say that intelligent and analytical individuals are more trustworthy for examining complex data but this show that may not be the case. In addition, this data was very clear and quantifiable so consider what might happen when the data itself is unclear. People could see the exact same situation can draw completely opposite conclusions from it.
Most of the time people are quick to accept information that is consistent with their beliefs and quick to reject information that is inconsistent with their beliefs. When the reality is that we should do the exact opposite. We should question information that is consistent with our beliefs more. We should stop and take a deeper look because it may not actually support our beliefs, the evidence might be showing the opposite. At the same time we should be more open to accepting information that is contrary to our beliefs. Usually we want to question and challenge contrary information until we have a reason to reject it. Instead next time look at it and question it but accept that it could be accurate and true. Everybody should be open to changing their beliefs when reality demonstrates them false. We are all human and thus fallible; keep that in mind when looking at evidence. It is not a character flaw to replace a false belief with a true belief; it is a character flaw to hold false beliefs in the face of contrary evidence.


